About
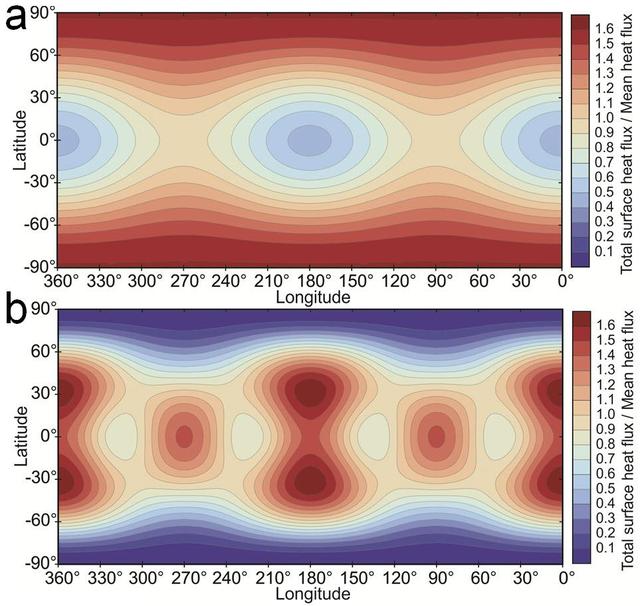
This map shows predicted heat flow at the surface of Jupiter moon Io from two tidal-heating models. Red indicates areas where more heat is expected; blue where less heat is expected. — NASA JPL · 2013. ABD devlet eseri: kamu mali, ticari islerde de serbestce kullanilabilir.
Source and licence
This work is public domain or openly licensed. The licence terms are published by the source.
How do I open it?
Use the Shopy 101 app to download it or read it in place. Anything you add to your library stays the same on every device.