- Introduction
- Different Types of Data
- Methods of Data Collection
- Data Analysis
- Summary Statistics
- Displaying Data
- Probability
- Distributions
- Testing Statistical Hypothesis
- Purpose of Statistical Tests
- Formalism Used
- Different Types of Tests
- z Test for a Single Mean
- z Test for Two Means
- t Test for a single mean
- t Test for Two Means
- paired t Test for comparing Means
- One-Way ANOVA F Test
- z Test for a Single Proportion
- z Test for Two Proportions
- Testing whether Proportion A Is Greater than Proportion B in Microsoft Excel
- Spearman's Rank Coefficient
- Pearson's Product Moment Correlation Coefficient
- Chi-Squared Tests
- Approximations of distributions
- Point Estimates </span> as of 12:07, 28 March 2007 (UTC)"}'>
 (12:07, 28 March 2007 (UTC))
- Unbiasedness
- Measures of goodness
- UMVUE
- Completeness
- Sufficiency and Minimal Sufficiency
- Ancillarity
- Practice Problems
- Numerical Methods
- Time Series Analysis
- Multivariate Data Analysis
- Analysis of Specific Datasets
- Appendix

Moving Average
A moving average is used when you want to get a general picture of the trends contained in a data set. The data set of concern is typically a so-called "time series", i.e a set of observations ordered in time. Given such a data set X, with individual data points 
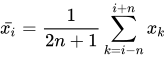
The moving average for many time-based observations is often lagged. That is, we take the 10 -day moving average by looking at the average of the last 10 days. We can make this more exciting (who knew statistics was exciting?) by considering different weights on the 10 days. Perhaps the most recent day should be the most important in our estimate and the value from 10 days ago would be the least important. As long as we have a set of weights that sums to 1, this is an acceptable moving-average. Sometimes the weights are chosen along an exponential curve to make the exponential moving-average.